Role: Principal Product Designer (Lead Architect)
Team: 2 Data Engineers, 1 Product Manager, Client Success Lead
Timeline: March 2025 – August 2025
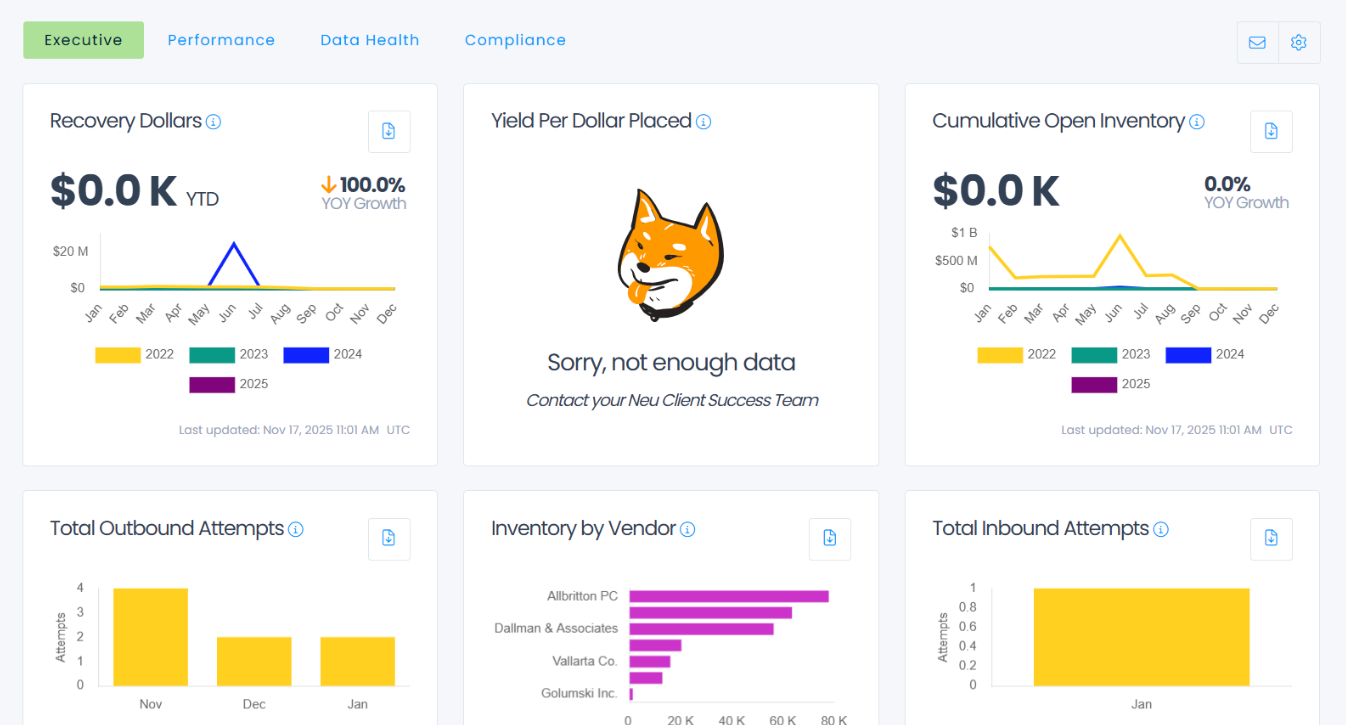
Executive Dashboard
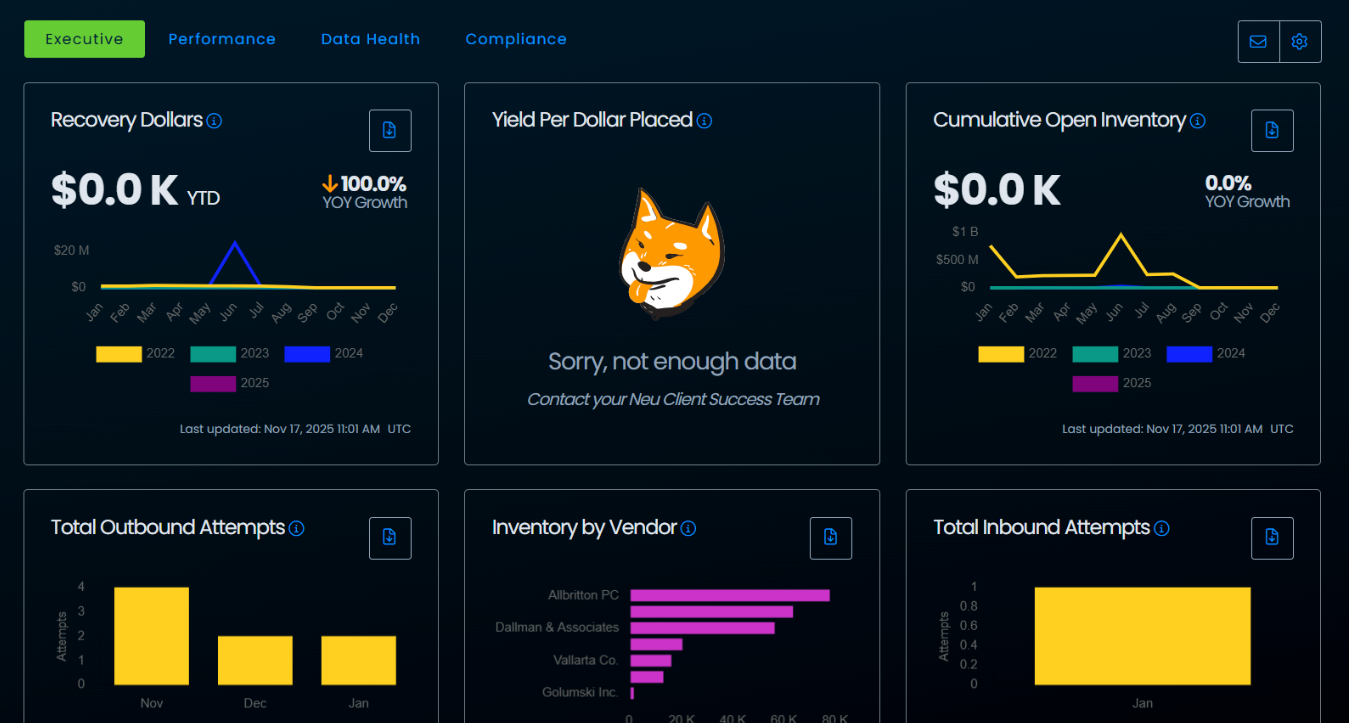
Dark Mode
Note: All visual examples are conceptual abstractions for confidentiality.
The Challenge: From Information Asymmetry to Competitive Advantage
At the onset, Fortune 500 clients—managing massive recovery portfolios—were forced to rely on manual spreadsheet analysis.
• The Business Risk: A lack of visual intelligence was causing Competitive Friction during RFPs, where modern analytics are now a baseline requirement for enterprise SaaS.
• The Support Tax: Client services teams were bogged down by constant requests for custom data extracts, as executives lacked a real-time pulse on vendor performance.
• The Goal: Architect a modular framework that scales from high-level executive summaries to granular compliance views without refactoring core UI logic.
The Leadership Signal: Metric Governance & Alignment
To address the "missing stakeholder influence" signal, I led the cross-functional effort to define the system's intelligence layer:
• I led workshops with Data SMEs to define "Exception Logic." We negotiated the thresholds for Red/Yellow/Green indicators to ensure they reflected actual business risk, not just arbitrary data points.
• I negotiated the trade-off between "Infinite Customization" (requested by Sales) and "Systemic Performance" (required by Engineering).
• The Choice: I advocated for a Modular Widget Framework over static dashboards. This allowed Sales to promise "custom views" while Engineering only had to maintain a single, reusable component library.
Renewals Dashboard
Ownership: Engineering a "Source of Truth"
• I architected a Global Semantic Filtering engine. By enforcing universal logic for date ranges and business units, I ensured that an Executive and an Ops Manager are always looking at a "single source of truth," eliminating data interpretation errors.
• I engineered the "Rotational Harmony" color system. Using AI-assisted color theory, I developed an accessible (WCAG) palette that maintains visual distinction in data-dense charts—a decision artifact that prioritized legibility over purely aesthetic "pretty" colors.
• I implemented native Dark Mode and high-contrast support, specifically designed to reduce eye strain for power users in high-volume environments.
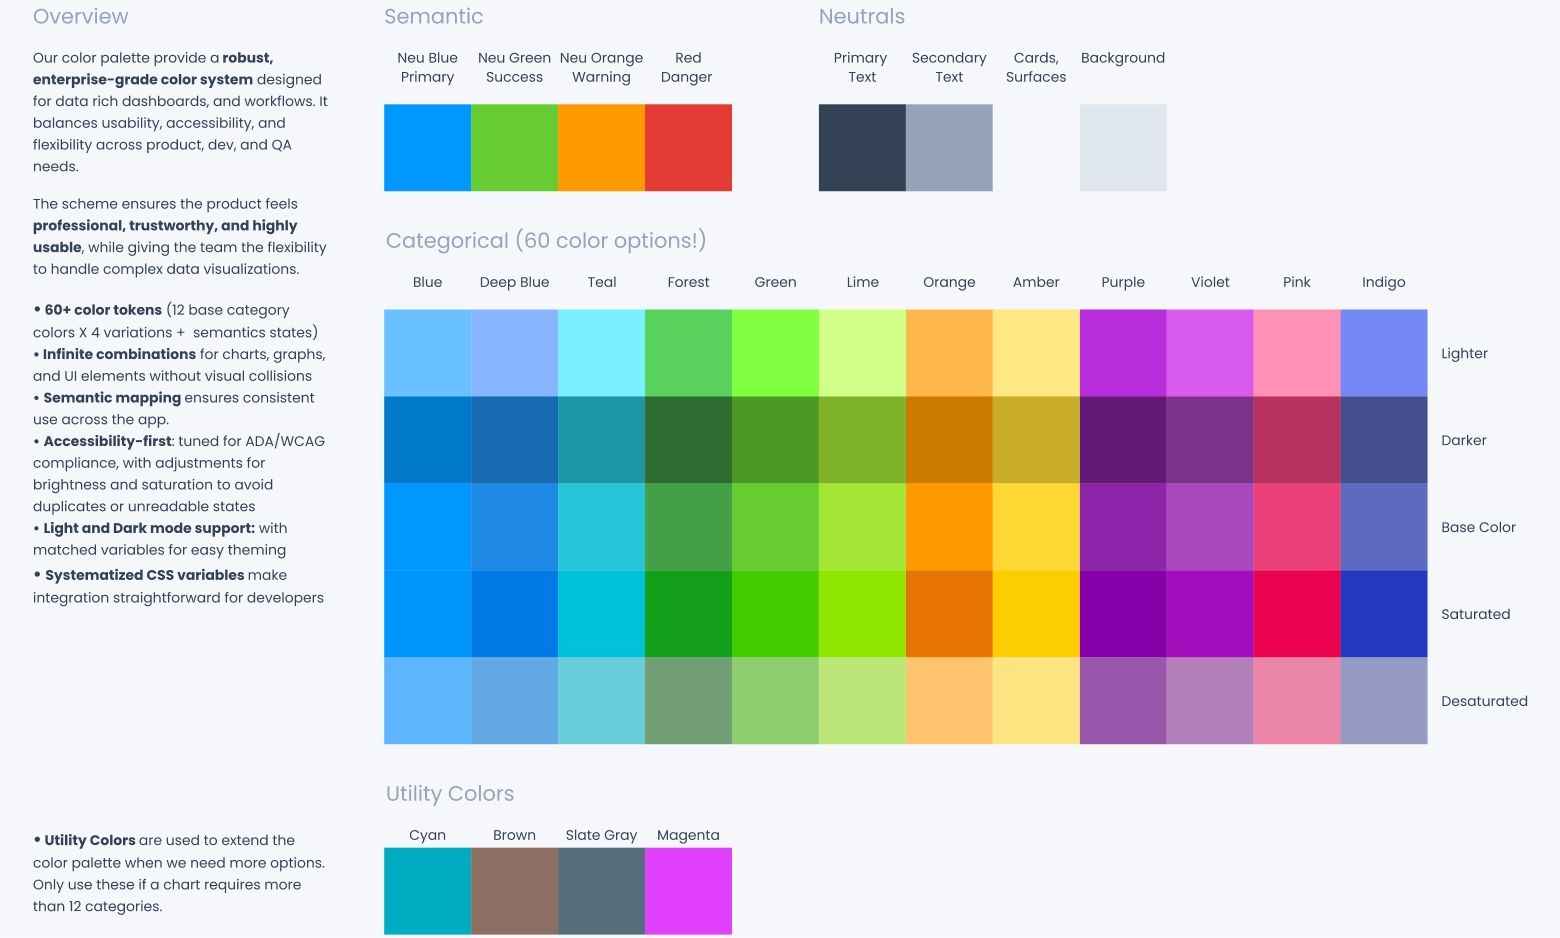
Color Usage
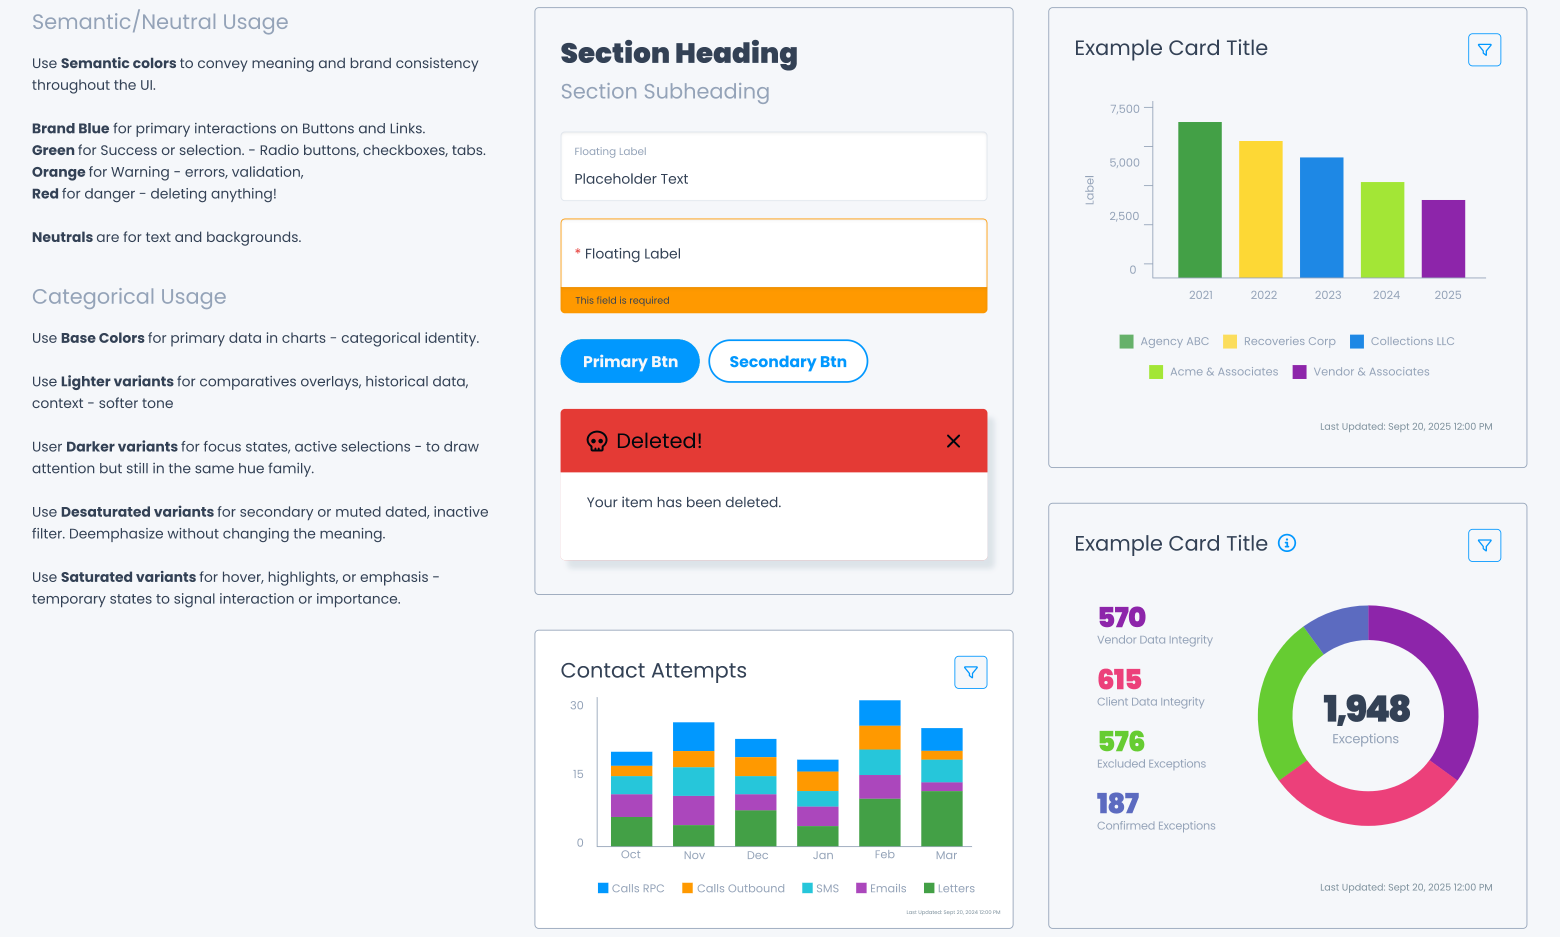
Examples
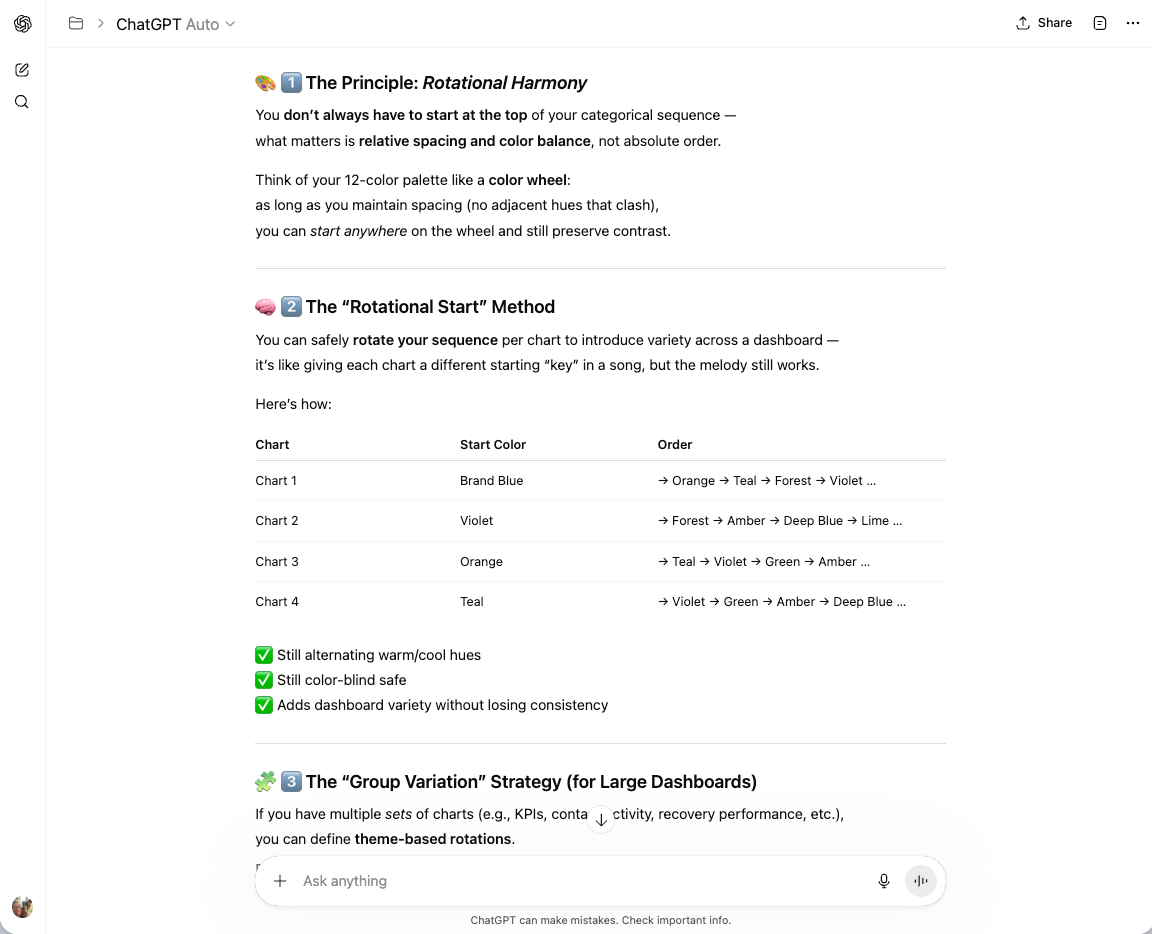
AI-assisted color theory
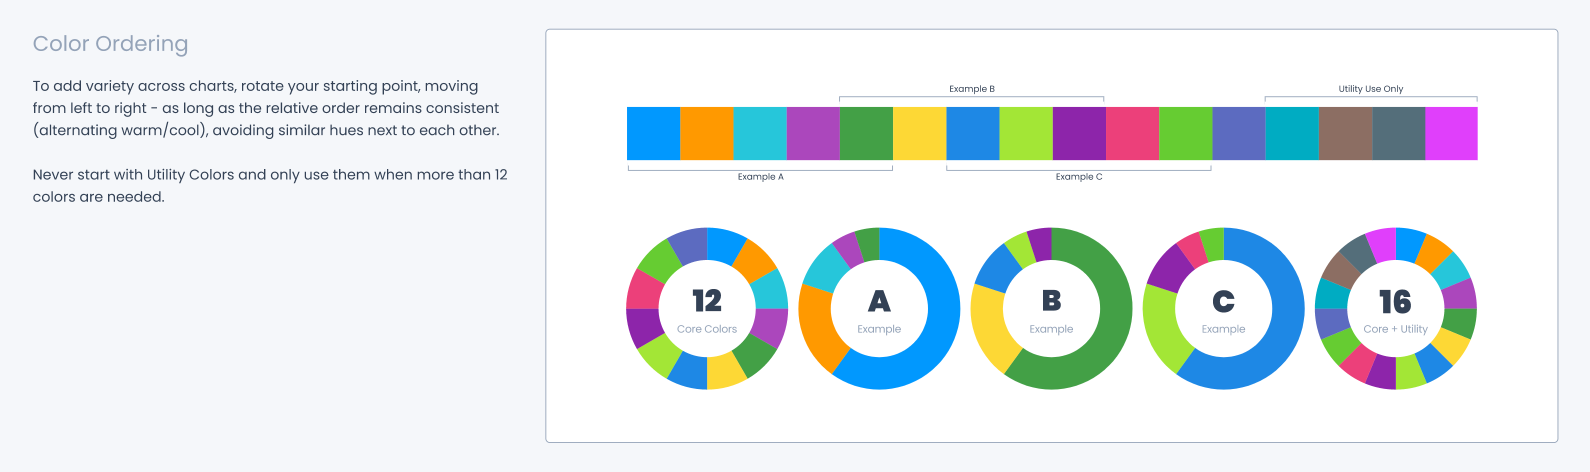
Rotational Color Harmony
Strategic Outcomes & Measurable Value
The reviews noted that "missing outcomes lead hiring teams to assume limited impact". These results prove the framework's success:
• 50% Faster Deployment: The reusable component library allowed the engineering team to deploy new dashboard modules (Renewals, Legal Management) in half the time of previous builds.
• Accelerated Sales Pipeline: The new analytics suite became a primary differentiator, contributing directly to multiple RFP wins with Tier-1 financial institutions.
• Operational Velocity: Empowering clients with self-service discovery and automated "Email Digests" led to a measurable reduction in custom data requests to the support team.
• Increased Executive DAU: High-level summaries and scheduled refreshes drove a significant increase in Daily Active Users among executive-level personas.
Compliance Dashboard
Let’s Connect
I specialize in untangling complex enterprise workflows and bridging the gap to engineering. If you’re looking for a Product Architect to lead your next zero-to-one initiative, let’s connect.